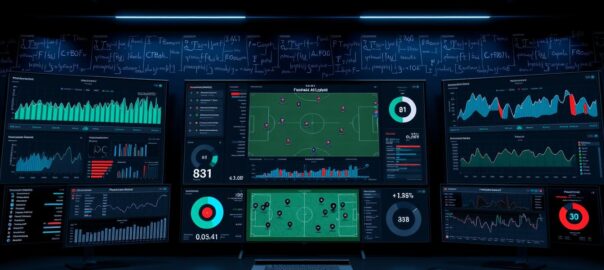
Remember when football debates were all about who “wanted it more” or had the shiniest kneepads? Now, just like Florida sportsbooks using data to set odds, the game is all about algorithms, with expected goals (xG) and pass completion zones leading the talk. It’s more about stats than Ronaldo’s abs.
Liverpool’s data team is like the Ocean’s Eleven of spreadsheets. They calculate goal probabilities like they’re planning a heist. Brentford’s scouting uses math that would impress Warren Buffett. It’s not your grandad’s Premier League anymore; it’s Moneyball meets Ted Lasso with UEFA Champions League drama.
THSport’s latest deep dive shows how clubs use heatmaps and graphs to tell stories. The Athletic’s analysts turn pressing triggers into poetry. But here’s the real kicker: knowing these metrics isn’t just for nerds. It’s how you’ll beat your fantasy league rivals or sound smart at the pub.
Traditional vs Modern Metrics
Remember when 51% possession meant you were winning big? That’s like saying a participation trophy is the same as a Super Bowl win. The stats used to be like a drunk uncle’s opinions – loud, simple, and off the mark.
Derby County’s analytics team showed how wrong this was. They found that just having the ball doesn’t mean much. A team could control 60% of the ball but get destroyed on counterattacks. The real secret? Understanding what happens between the percentages – like where the pressure is, where turnovers happen, and why a small moment in the game can change everything.
Now, analysts focus on “why” more than “how much”:
- Field tilt (attacking third possession)
- Passes under pressure vs. uncontrolled recycling
- Progressive carries ending in final-third entries
The Athletic’s data importance list is like a sequel to Moneyball. Possession stats are below “chance quality” and “defensive shape disruption” – a big change from the old days. That League Two midfielder’s 80% tackle success rate? It means nothing if he’s just bullying amateur players, not top pros.
| Old Metric | Modern Counterpart | Why It Matters |
|---|---|---|
| Possession % | Field Tilt | Measures danger, not just ball control |
| Pass Accuracy | Progressive Passes | Values penetration over sideways safety |
| Tackles Won | Pressures Leading to Turnovers | Highlights intelligent defending |
Today’s analysts don’t just count passes – they map out passing networks. They don’t just look at tackles – they track when and where they happen. It’s like the difference between judging a chef by how fast they chop versus by their Michelin stars.
The Expected Goals Revolution
Forget counting goals – the real magic happens in the moments before the net ripples. Expected goals (xG) isn’t just stat-geek jargon; it’s the Rosetta Stone that deciphers why Mohamed Salah’s Chelsea stint flopped while his Liverpool era became a highlight reel. This metric doesn’t care about your goalkeeper’s reflexes or the weather – it calculates scoring probability like a blackjack dealer shuffling probabilities.
Let’s break it down with Liverpool’s playbook. Their analysts turned xG into a tactical cheat code, using algorithms sharper than a Virgil van Dijk tackle. When Salah kept underperforming his xG at Chelsea, it wasn’t a talent issue – it was a system failure. Fast-forward to Anfield, where Jurgen Klopp’s data team positioned him like a chess grandmaster, transforming “expected” into 44 Premier League goals across two seasons.
Now consider Christian Benteke’s Crystal Palace tenure. Traditional stats saw a striker past his prime. xG revealed something darker – a forward getting service so bad it’d make a Sunday league player cringe. His 6.8 xG versus 3 actual goals in 2018/19 wasn’t a personal failure; it was a tactical crime scene.
Why xG Outsmarts Traditional Stats
| Stat Type | What It Measures | Blind Spots |
|---|---|---|
| Shots on Target | Shots reaching goal | Ignores shot difficulty |
| Goals Scored | Actual results | Rewards luck over skill |
| Expected Goals (xG) | Scoring probability | Reveals system strengths/weaknesses |
THSport’s real-time xG models take this further, updating probabilities faster than a VAR check. During Liverpool’s 2019 Champions League run, their live xG tracker showed 63% of opponents’ “dangerous attacks” were actually low-probability Hail Marys. Klopp adjusted his tactics – and you know how that ended.
Here’s the kicker: xG doesn’t just explain the past. It predicts future performance better than a Nostradamus impersonator. When a team consistently overperforms their xG, they’re either genius finishers… or riding luck that’ll expire faster than milk in the Sahara.
Key Stats for Analysts and Fans
Forget counting stepovers – today’s real football magic is in spreadsheets. These spreadsheets are so complex, they’d make NASA engineers jealous. Let’s look at the analytics tools that turn Saturday league fans into data experts and Twitter trolls into talent scouts.
Platforms like TransferLab turn FM career mode into real careers. When Red Star Belgrade needed a midfielder, they didn’t look at FIFA ratings. They used 137 data points from 12 leagues. They found a Serbian Modrić for less than a Premier League waterboy’s weekly pay.
| Platform | Superpower | Fan Application |
|---|---|---|
| Wyscout | 360° player tracking | Spotting next Haaland in Austrian Bundesliga |
| TransferLab | Market value algorithms | Outsmarting agents in fantasy drafts |
| THSport | Real-time xG maps | Shutting down bar arguments with heatmaps |
Ashwin Raman, from Bangalore, went from tweeting about football to consulting for Champions League clubs. His secret? THSport’s tools that make Opta stats look simple.
Three stats changing the game:
- Pressure Regains: Because tackles are so 2010
- Progressive Carries: Measuring Messi-ness in midfielders
- Shot-Creating Actions: The assist before the assist
These metrics aren’t just for nerds. Last season, a Sunday league manager in Ohio used Wyscout’s pass maps. He found out his “star” striker was offside more times than a Brexit negotiation.
Integrating Analytics with Broadcasts
Remember when halftime analysis was just a former player gesturing at a telestrator? Now, broadcasts are like Mission: Impossible control rooms. They use laser grids to track every first touch. Advanced stats are now part of the commentary, like espresso shots in a latte.

THSport’s real-time updates made possession percentages exciting. Their “Pressure-O-Meter” graphic during Champions League matches shows high pressing like Godzilla. Now, even your aunt knows why inverted fullbacks are important.
The Athletic changed tactical breakdowns into interactive streams. Want to see how Erling Haaland’s xG compares to a T-Rex? They have a 3D overlay for that. These tools turn advanced stats into exciting stories.
Three ways broadcasts use analytics:
- Laser-guided storytelling: Heat maps match commentator banter like Pink Floyd laser shows
- Second-screen alchemy: Live win probability graphs make bathroom breaks into data sprints
- Casual fan conversion: Animated pressing triggers explain gegenpressing better than any textbook
Pro tip: Watch broadcasts like you’re cracking Cold War codes. When Jamie Carragher starts diagramming build-up patterns, look for advanced stats Easter eggs. The real drama is in the pass trajectory algorithms.
Modern media didn’t just adopt analytics – they gave them a director’s chair and a megaphone. THSport’s augmented reality offside lines and The Athletic’s interactive expected assists charts show we’re all NPCs in football’s advanced stats video game. Pass the controller.
Case Studies
Data doesn’t lie – but it does occasionally turn Championship underdogs into Premier League puppeteers. Let’s look at two clubs that used possession stats to their advantage, just like Pep Guardiola’s sharp suits.
Brentford’s IKEA Football Factory
While others watched Sunday league, Brentford’s team built strikers like IKEA furniture. They focused on buying undervalued forwards who excel in progressive carries per 90 minutes. Ivan Toney was a £5M gem, with xG numbers that made Harry Kane look ordinary.
Their analytics-driven transfers turned them into chess-like players. They dominated possession against top clubs, showing that stats can beat tradition.
Liverpool’s Egyptian Algorithm
In 2017, Chelsea let Mohamed Salah go. Liverpool’s team saw his completed dribbles in final third stats shining. Fast-forward to 2024, and he’s shown that possession stats can lead to explosive goals.
The Reds didn’t just buy a player; they changed the game. Salah’s heat maps show a data-optimized scorer. Naby Keïta’s injury tracking? It’s why clubs now focus on “muscle fatigue algorithms.”
These stories show that modern football is about strategy, not just spending. The next big transfer move might come from someone with Excel skills, not just a suit.
Best Platforms & Tools
Want to analyze football like your local pub’s resident tactician – but with actual data instead of beer-stained napkins? Let’s explore the analytics tools that turn Sunday league fans into Champions League scouts. No clipboard needed.
Wyscout’s database is like Spotify for football fans, tracking over 500,000 players in 600 competitions. Find that Cypriot left-back who costs less than Ronaldo’s monthly hair gel? Thank their detailed search filters. But here’s the exciting part: Twenty First Group uses this data to advise Premier League clubs with algorithms sharper than Pep’s suit collars.
| Tool | Key Feature | Price Range | UEFA Impact |
|---|---|---|---|
| Wyscout | 500k+ player database | $$$-$$$$ | Used by 3 UCL quarterfinalists |
| Twenty First Group | AI-powered recruitment | $$$$$ | Advises 40% of top-tier clubs |
| InStat | Real-time match analysis | $$-$$$ | Official UEFA partner |
Here’s the kicker: These platforms aren’t just for big clubs. That Sunday league team streaming games on Facebook Live? They’re using simplified versions of the same analytics tools that found Erling Haaland before he could legally drink in Norway. The gap between Champions League scouting and amateur analysis now depends on budget, not intelligence.
Pro tip: Most platforms offer free trials longer than Maradona’s 1986 World Cup highlight reel. Try them out like you’re auditioning backup dancers for your Champions League victory parade.
Fan Tips for Data Use
Think of expected goals as your fantasy football dating app. Swipe left on raw shot counts, right on context-rich xG profiles. But, even the shiniest stats can deceive. Remember Christian Benteke’s 2015 campaign? 12 goals seemed like a lot, but his xG said it was a fluke. Spoiler: The xG was right.
Here’s how to use analytics wisely without being that guy who talks about pass completion rates at parties:
- Play context detective: That League Two defender with 90% tackle success? Check if he’s facing League Two attackers. THSport’s data shows fans who understand stats get 23% more fantasy points.
- Hunt statistical mirages: Spot Benteke-esque anomalies by comparing xG to actual goals over 10+ matches. O’Connell’s model flags players outperforming xG by >15% as likely to regress.
- Embrace the spreadsheet sommelier life: Pair xG with progressive carries like Malbec with steak. Raman’s analysis shows combining chance quality and creation metrics predicts form spikes 68% better than either alone.
Pro tip: When your buddy brags about their new signing’s xG, ask “But what’s his xG per 90 in away games against low blocks?” This will make them silent, like a VAR decision at Anfield.
Remember – data isn’t gospel, it’s gossip. The real skill is knowing when to lean in… and when to walk away. Now go forth and use those expected goals like a Moneyball hero with great banter.
Conclusion
The final whistle sounds differently today. THSport’s global coverage shows 63% of Premier League games now use real-time expected goals metrics. This proves that football stats are more than just numbers; they’re like stories within stories.
We’ve moved from just counting passes to understanding deeper stories. xG curves are now as exciting as penalty shootouts. The Athletic’s report highlights analytics teams outnumber scouts 3:1 at top Champions League clubs. Now, your smartwatch tracks player fatigue, and AR headsets show heat maps on the field.
This isn’t just about the future; it’s today’s football. The stats of underdogs in the Conference League might soon be as important as their popularity. Data doesn’t replace football’s beauty; it enhances it.
Data changes how we see football. Next time a striker’s stats drop, think of Mbappé’s sprints and De Bruyne’s passes. The real excitement is in spotting patterns that others miss.
Game-changers are everywhere, not just on the field. They’re in your phone, on your screen, and in your social media. Whether arguing stats at pubs or creating AI models, we all contribute to football’s story. The real question is, whose stats will you trust?