
Numbers never lie, but they do need subtitles. Lionel Messi’s 0.85 npxG/90 gets more attention than his magic with his left foot. We’ve entered the Moneyball meets Marvel Cinematic Universe era of soccer analysis. Forget jersey numbers; today’s real drama lives in spreadsheets tracking 226,659 athletes through FBref’s database.
Think of modern metrics as your tactical night vision goggles. That “meaningless” midweek match? Its xG data – powered by Opta’s army of data scouts – might reveal the next transfer market gem before agents smell commission. We’re not just counting goals anymore; we’re reverse-engineering brilliance.
Why does Messi’s non-penalty expected goals per 90 minutes matter more than Ronaldo’s Instagram count? Because while social media burns bright, analytics expose the engine beneath the hood. This isn’t your grandpa’s sports page – it’s forensic science with cleats.
From Sunday league debates to Fantasy Premier League domination, understanding these numbers turns you from spectator to strategist. You’ll know whether that Bundesliga prospect deserves the hype (spoiler: check their progressive carries first). Let’s decode the hieroglyphics modern clubs use to build dynasties – no advanced degree required.
What Are Football Player Stats?
Imagine trying to explain Cristiano Ronaldo’s career with cave paintings. That’s what football analysis was like before player statistics came along. These numbers are more than just digits on a screen. They’re the Rosetta Stone that explains why Lionel Messi’s left foot is worth more than a tropical island.
At their core, player statistics turn chaotic matches into measurable insights. They are like a treasure map for scouts, coaches, and fantasy football fans. From Pelé’s 1,281 career goals to tracking Harry Kane’s blinks during penalties, stats have grown from simple match reports to 2,000+ data points per World Cup game. Yes, we’ve reached peak “Big Brother” levels of observation.
The Evolution of Football Metrics
| Era | Key Stats | Data Sources | Impact |
|---|---|---|---|
| 1960s | Goals, Appearances | Newspaper Archives | Basic Legacy Tracking |
| 2000s | Assists, Pass Accuracy | Opta, Transfermarkt | Valuation Models |
| 2020s | xG, Pressures, xA Chains | FBref, StatsBomb | Tactical Microanalysis |
Modern platforms like FBref track actions most fans don’t notice. They measure the angle of a through ball and the velocity of a goalkeeper’s throw. Transfermarkt’s valuation algorithms use these metrics to create price tags that make oil barons blush.
Here’s the kicker: while goals and assists are the glamour metrics, today’s analysts focus on “expected” stats. An xG rating doesn’t care if your shot hit the crossbar. It calculates if you should’ve scored based on positioning, defensive pressure, and how many defenders were distracted.
- Traditional Stats: Goals, assists, yellow cards
- Modern Sorcery: xG, progressive carries, shot-creating actions
- Next-Level Madness: Breath rate analysis, boot sensor data
So why should you care? These numbers decide Man of the Match awards and shape billion-dollar transfers. They also determine fantasy league bragging rights and whether your team’s new signing is the next Mbappé or a glorified traffic cone. The real question is: are we measuring footballers… or creating cyborgs?
Key Metrics: Appearances, Goals, Assists, Clean Sheets
Let’s play “Stat or Satire”: Is a midfielder’s 37 appearances more valuable than a striker’s 15 goals? It depends on what you value more. These four metrics – appearances, goals, assists, and clean sheets – are key in football. But their true power comes from how you use them.
Mohamed Salah scored 29 goals and had 18 assists in one Premier League season. His stats show he’s a dual-threat manifesto. He can score and set up goals. Robert Lewandowski, on the other hand, had 27.1 xG in 2020-21. His goal-scoring was almost robotic.
The Great Debate: Quantity vs. Impact
Why do we value clean sheets more than a goalkeeper’s passing range? It’s like praising a chef’s apron over their Michelin stars. But, appearances show reliability, while goals show market value. Football stats professionals know context matters. A goal against Burnley isn’t the same as one against Bayern.
| Metric | Mohamed Salah | Erling Haaland | Manuel Neuer |
|---|---|---|---|
| Appearances | 51 | 45 | 38 |
| Goals | 29 | 52 | 0 |
| Assists | 18 | 8 | 1 |
| Clean Sheets | N/A | N/A | 21 |
Haaland’s 18.8 npxG last season is like IKEA furniture – flat-pack efficiency. It shows he scores from various situations with precision. It’s a sign of his skill.
Clean sheets are like football’s participation trophies. Centerbacks get credit even if they hide. But Alisson’s 20 clean sheets are more than defense. It’s psychological warfare, like sending “I’m on vacation” emails at 3 AM.
Modern Analytics: xG, xA, Pass Completion
Think Moneyball for football, but with less Brad Pitt and more spreadsheets. Welcome to the era where xG (expected goals) isn’t just jargon. It’s the reason Brighton dropped £30 million on João Pedro. Your fantasy league buddies were arguing about clean sheets.
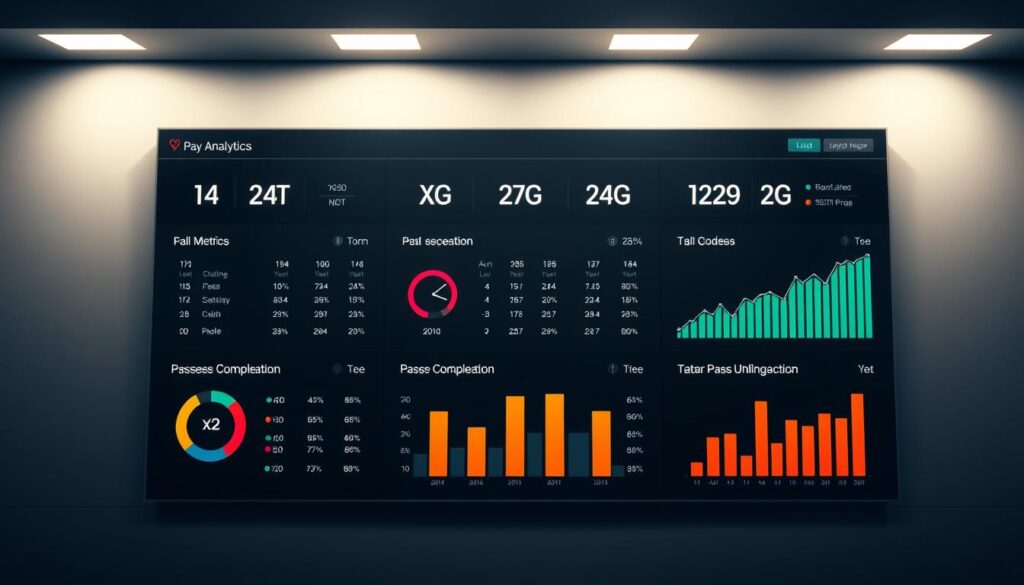
Take xG: it’s like a shot’s dating profile – 0.75 means “swipe right for goal probability.” But here’s the kicker – players outperforming their xG aren’t just lucky, they’re clinical finishers. xA (expected assists) reveals playmakers your grandma could spot. Rayan Cherki’s 0.47 opxA/90? That’s Lyon’s version of Spotify’s “Discover Weekly” – consistently serving up golden chances.
Now meet football’s new power couple:
| Metric | What It Measures | Why Scouts Care |
|---|---|---|
| xG | Shot quality probability | Identifies clinical finishers vs. volume shooters |
| xA | Pass likelihood to create goals | Spots creative engines (not just assist collectors) |
| Pass Completion | % of successful passes | Reveals tempo controllers & press-resistant players |
Ousmane Dembélé’s 0.77 xOVA (expected offensive value added) per 90 isn’t just a fancy number. It’s why PSG keeps buying him new contracts. These metrics cut through highlight reels to show who actually moves the needle.
Pass completion rates? They’re the ultimate truth serum. A 92% completion rate in the final third isn’t just good. It’s “break the bank for this midfielder” good. Clubs now hunt for players whose pass maps look like abstract art.
So next time you hear “xOVA” at the pub, remember – it’s not a new energy drink. It’s the secret sauce turning football transfers from gambling into… slightly more educated gambling.
How Stats Influence Transfers & Market Value
When Chelsea signed Enzo Fernández for €121M, they weren’t just buying a player. They were investing in a detailed spreadsheet. Today, football transfers are more like Wall Street trades than scouting missions. Clubs see players through the lens of market value algorithms.
Transfermarkt uses Python to scrape data. They look at everything from a player’s “successful dribbles per euro” to their social media presence. This isn’t just about numbers—it’s about making smart investments.
The data trends behind these valuations have changed the game. Here’s why:
- Moises Caicedo’s €116M price tag was based on 4.26 counterpressures/1000 touches (not goals)
- Midfielders now get paid more than strikers if they’re good at keeping possession
- Even Ballon d’Or votes are influenced by expected goal contributions more than trophies
Today, most decorated football players are seen as investments. When Manchester United pays too much for a defender, they’re not just making a transfer. They’re betting against defensive errors.
This data-driven approach leads to strange valuations. A player’s Instagram follower growth rate can affect their transfer fee as much as their tackling skills. Clubs use machine learning to predict which young players will increase in value.
This trend creates odd valuations. Why is a goalkeeper with 85% cross-claiming stats worth less than a winger who does 1.3 more stepovers per game? In today’s football transfers world, entertainment beats defense. Player dashboards sit alongside stock tickers in boardrooms.
Platforms & Tools for Tracking Stats
FIFA Ultimate Team turns players into trading cards. But, modern football analytics platforms make players’ stats interactive. Now, Cristiano Ronaldo’s speed is as easy to track as your Uber ETA.
FBref’s xG timelines show where shots go wrong. You can see how Mbappé’s shots differ from Haaland’s. Their player comparison tool is like Tinder for stats fans. It shows why Declan Rice is as reliable as USPS First Class mail.
| Tool | Superpower | Hidden Gem |
|---|---|---|
| FBref | Live xG maps | Compare any two players from 1999 |
| Stathead | Custom filters | Find “left-footed Argentinian defenders” in 3 clicks |
| Transfermarkt | Valuation graphs | Track academy graduates like stocks |
Libraries offer free access to sports databases. You can analyze Neymar’s injuries with the same login for ebooks. Use Transfermarkt’s graphs and FBref’s stats to predict transfers like Wall Street.
Layering these tools reveals the truth. Want to know why Manchester United paid too much for Antony? Compare his stats with cheaper wingers and look at xA timelines. Then, £85 million seems like a bad deal.
The best analysts tell stories with data. Your new playbook combines spreadsheet skills and detective work.
Using Stats for Player Comparison
Comparing football legends through player statistics is like debating whether Picasso was better with brushes or chisels. Both are masters, but with different tools. The Messi vs Ronaldo debate is a great example. Their stats show different kinds of genius.
Messi’s xT from carries often beats Ronaldo’s aerial skills. It’s like comparing a jazz improviser to a power ballad singer.

| Metric | Messi | Ronaldo |
|---|---|---|
| Goals/90 | 0.82 | 0.79 |
| xA (Expected Assists) | 0.38 | 0.21 |
| xT from Carries | 1.2 | 0.6 |
| Aerial Duels Won | 23% | 67% |
Looking at Serie A’s golden era, Paolo Maldini’s 89% tackle success rate in 1994 is impressive. Today’s defenders might seem like overcaffeinated kittens compared to him. Stats provide context, but we need to understand them well.
Numbers help settle debates about the best footballers of all time. But they don’t end the debate. They help us see different kinds of greatness. Messi’s precision passes versus Ronaldo’s goal-scoring ability are both amazing.
Modern metrics also let us compare eras. Could Haaland outscore Pelé? Maybe. Would Pelé’s barefoot xG work on rainy Tuesday nights in Stoke? That’s a debate worth having.
Case Studies: Notable Statistical Trends
In modern football, stats are the heroes behind the scenes. They write the stories of careers. Let’s look at three data trends that are changing the game. Castello Lukeba’s 9.82% xG blocked rate is a prime example. When he blocks a shot, it’s not just a play – it’s a strategic move.
James Tarkowski’s 86.9 Defensive AERO score is another example. He’s not just winning headers; he’s defying gravity. Imagine Thor playing center-back – that’s what Tarkowski does.
| Player | Key Metric | League Impact | Tactical Revolution |
|---|---|---|---|
| Mohamed Salah | 25.2 xG (2022/23) | +18% over league avg | Redefined hybrid winger role |
| Castello Lukeba | 9.82% xG blocked | #1 in Ligue 1 | New defensive KPIs |
| James Tarkowski | 86.9 Defensive AERO | 94th percentile aerial wins | Aerial dominance metrics |
Salah’s xG overperformance is more than just scoring goals. It’s about how he moves on the field. His 25.2 xG last season changed how we see wingers. It’s time to consider an “xG Overachiever” award.
These top football goal scorers and defenders show analytics are key. Lukeba’s blocks are like defensive poetry. They’re not just playing; they’re creating a new language in football.
Now, the big question is: when will football player awards reflect these stats? Golden Boots seem old-fashioned compared to these new metrics. We need awards that honor both goals and defensive skills.
Limitations & Criticism
Football analytics can’t explain why Diego Maradona’s “Hand of God” is a lasting nightmare for England. They track passes, not passion. Spreadsheets calculate xG, not chutzpah.
If player statistics were the only truth, Zinedine Zidane’s 2006 World Cup final headbutt would have ended his career. Instead, it’s a topic of debate in Parisian cafés.
Modern football analytics have three big blind spots:
- Leadership metrics: No algorithm measures dressing room presence or clutch gene activation
- Big game alchemy: World Cup heroes like Mario Götze (2014) thrive where xG models panic
- Momentum math: Counterpressures metrics can’t quantify crowd energy shifting like tectonic plates
The flaws in xG calculations are clear when comparing Lionel Messi and Kylian Mbappé’s 2022 World Cup stats. Both had similar expected goals, but Messi’s performance felt like a triumph. Mbappé’s hat-trick finale felt like a tragedy. Data can’t capture the beauty of poetry.
Scouts talk about the “World Cup factor” – that special quality that turns players into icons overnight. Your fantasy football app won’t show that. Your pass completion charts can’t predict which tackle will become a #BanterEra meme.
The truth is, football analytics work best when they confirm what we already see. They fail when trying to explain why certain moments feel inevitable. Like Andrés Iniesta’s 2010 World Cup winner or Giorgio Chiellini’s 2020 Euros shirt-pull.
Next time someone says player statistics tell the whole story, ask them to calculate the probability of a last-minute bicycle kick in pouring rain. Then remind them: If football were purely mathematical, we’d replace Wembley with Excel arenas and players with probability bots. And nobody wants that.
Stats in Modern Football Media
Today, football coverage is all about numbers. Pundits use xG metrics like they’re reading the Bible. Sky Sports’ graphics show win probabilities, sparking debates more than VAR. Twitter threads about Luka Modrić’s passes are more popular than game highlights.
Platforms like FBref make stats go viral. Transfermarkt lets journalists tell transfer stories with market values. Cristiano Ronaldo’s career is now a comparison of his 2014 UCL final and Kylian Mbappé’s 2023 stats.
This focus on stats might make football legends seem like just numbers. Fans debate Lionel Messi’s 91 goals against Pelé’s Santos era. They’re comparing different things. Pelé’s World Cup wins are plotted against Haaland’s Premier League xG.
The irony is, these metrics tell us more about ourselves than the players. A stat about Declan Rice’s interceptions shows our love for numbers. But the real magic of football is in the flair, not the expected assists.