
Comparing athletes is a challenge in itself. We enjoy debating and ranking them. But, is the game rigged from the start? Judging a footballer by one number is like judging a movie by its poster.
The main issue, as analysis shows, is comparing different tools. Football is complex, and one metric can’t show everything. A player vs player stats sheet misses out on leadership and teamwork.
This isn’t just about personal taste; it’s about numbers. Modern football stats have their limits. Ratings are good for past performances but not for predicting the future.
So, when you’re about to compare Player A and Player B, remember. You’re comparing different things. It’s like comparing a masterpiece’s brushstroke to a single guitar riff. The full picture is hard to score.
Era adjustments
Think a goal is just a goal? Think again. Goals in 1994 and 2024 are as different as a flip phone and a smartphone. The game has changed a lot: tactics are more complex, players are faster, and the ball behaves differently.
To compare a striker from the 1990s Serie A to one in the 2023 Premier League is like comparing a horse-drawn carriage to a Tesla. The context of the player comparison football debate is not just about stats. It’s about the universe those stats were born in.
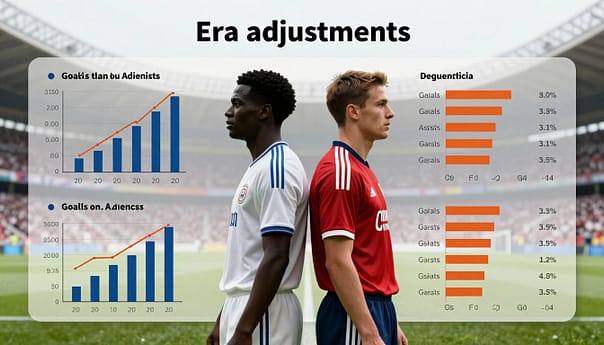
Context is Everything: Adjusting for the Game’s Evolution
You can’t analyze Babe Ruth’s home run record without considering he played in the dead-ball era. Football is no different. The “difficulty setting” of a league and era changes everything.
A prolific striker in the 1990s Serie A faced a brutally defensive league. Today’s Bundesliga is more open and attacking. The first step in any serious player comparison is adjusting for this “era difficulty.”
This is where advanced metrics are a game-changer. The MBAPPE metric mentioned in our first source attempts a “league adjustment.” It’s like the difference between landing on the moon (the 1990s Serie A) and landing on Mars (the 2020s Premier League). The gravity, atmosphere, and challenges are fundamentally different. Tools for era-adjusted stats are becoming essential for any meaningful cross-generational debate.
The “Messi & Ronaldo Problem”: A Case Study in Era and League Context
The GOAT debate is the ultimate case study. Is it fair to compare a goal Ronaldo scores in the Saudi Pro League to one Messi scored in the 2010s La Liga? The raw numbers tell one story, but the context tells another.
Messi’s 91-goal year and Ronaldo’s 61-goal season were supernova events. They were born from a specific tactical and competitive cosmos—a specific moment in football’s tactical timeline. Ignoring that is like crediting a chef for a great meal without mentioning the three-Michelin-star kitchen they used.
Let’s put their peak club seasons head-to-head, using a simple table to illustrate the raw data, which is just the starting point for a deeper conversation.
| Player | Season | League Goals | League Assists | League (Context) |
|---|---|---|---|---|
| Lionel Messi | 2011-12 (Barcelona) | 50 | 19 | La Liga (Spain) |
| Cristiano Ronaldo | 2014-15 (Real Madrid) | 48 | 16 | La Liga (Spain) |
| Cristiano Ronaldo | 2022-23 (Al-Nassr) | 14 | 2 | Saudi Pro League |
The table tells a surface story. But the context is the story. Messi’s 50 goals came in a historically dominant Barcelona side in a top league. Ronaldo’s 48 came in a similar elite context.
His recent Saudi Pro League goals, while impressive in volume, come from a league with a different competitive and tactical landscape. This isn’t to diminish the achievement, but to highlight the “Messi & Ronaldo Problem”: raw stats are just the opening argument, not the closing statement. A meaningful player comparison in football must start by adjusting for the “when” and “where” as much as the “how many.” It’s the difference between judging a chef by a meal and judging them by the meal they could make with the same ingredients as their rival.
Position-based metrics
Want to compare a striker to a winger? Or a modern full-back to a box-to-box midfielder from the 90s? Welcome to the analytics age. We’ve moved from old scout’s notes to spreadsheets that would impress NASA. Now, we ask “How, when, and why?” instead of just “How many goals?” This is the world of position-based metrics, where a player’s story is told in more than just goals and assists.
The Timo Werner Case Study: More Than Just Goals
Let’s talk about Timo Werner’s time at Chelsea. Saying he doesn’t score enough is like judging a Swiss Army knife as a bad sledgehammer. A player comparison that only looks at goals is unfair to the modern game. Analyzing his Chelsea stint shows why context matters.
His Expected Goals (xG) showed he was in the right spots. The issue wasn’t his movement; it was the final execution and the system. A comparison of his seasons in the Bundesliga and Premier League would show a differently utilized player. In Germany, he was a central threat. In the Premier League, his role and metrics changed.
From xG to xA: Decoding the Modern Forward
The modern forward is more than just a goal-poacher. We now evaluate the quality of chances they create for themselves (xG) and others (xA – Expected Assists). A winger might have a low xG but create space and successful dribbles. A defensive midfielder’s brilliance is in possession-adjusted tackles and passes that break lines.
Consider the evolution of the forward’s report card:
| Metric | Traditional Lens | Modern, Position-Based View |
|---|---|---|
| Primary Metric | Goals, Assists | Expected Goals (xG), Expected Assists (xA), Shot-Creating Actions |
| For a Striker | Goals Scored | Non-Penalty xG, Touches in Opp. Box, Shot-Creating Actions |
| For a Winger | Assists, Dribbles | Progressive Carries, xA, Successful Take-Ons in Final 1/3 |
| For a Defensive Midfielder | Tackles, Interceptions | Passes into Final 3rd, Pressures, % of Dribblers Tackled |
| For a Centre-Back | Tackles, Clearances | Passes into Final 1/3 Allowed, Aerial Duel Win %, Pressures in Mid 3rd |
This table isn’t just a list; it’s a philosophy shift. The old stats asked, “What did you do?” The new analytics ask, “How did you do it, and what did it lead to?” A defender isn’t just a destroyer; he’s a playmaker. A striker isn’t just a finisher; he’s a pressing machine. This is the player comparison football analysts use today: a multi-dimensional assessment that respects each position’s unique demands.
Head-to-head encounters
Forget the endless debates and Twitter wars. The player vs player stats give us a clear view. It’s a clash of footballing philosophies between Messi and Ronaldo. We’re moving past the “eye test” and into the numbers.
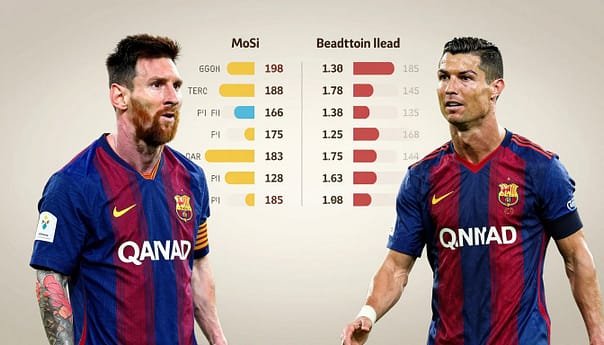
The Messi vs. Ronaldo Duel: A Statistical Smackdown
Our data shows a split decision of epic proportions. The tale of the tape is a study in contrasting dominance.
| Statistic | Lionel Messi | Cristiano Ronaldo |
|---|---|---|
| Career Club Goals | 715 | 715 |
| International Goals | 106 | 128 |
| UEFA Champions League Goals | 129 | 140 |
| Career Assists | 353 | 239 |
| Ballon d’Or Awards | 8 | 5 |
Ronaldo’s numbers scream relentless, predatory efficiency. He’s the Terminator of goal-scoring, a cyborg engineered to find the net with robotic, predatory instinct. His stats are a monument to physical peak, aerial dominance, and a relentless will to score. It’s a brutal, awe-inspiring kind of art.
Messi’s canvas is different. His numbers paint a portrait of a footballing Sistine Chapel. The goals are there in similar volume, but the masterpiece is in the assists. He’s not just the artist; he’s the architect of the entire attack. The stats tell a story of a playmaker so sublime he dominates the game’s creation, not just its conclusion. This is the heart of the player vs player stats debate: is the “finisher” or the “architect” more valuable?
Beyond the Ballon d’Or: Trophies, Trophies, Trophies
The silverware cabinet is the ultimate tiebreaker for many. Here, the stats reveal a different, more complex picture of success.
| Trophy | Lionel Messi | Cristiano Ronaldo |
|---|---|---|
| UEFA Champions League | 4 | 5 |
| League Titles | 12 | 7 |
| Domestic Cups | 7 | 7 |
| International Trophies | 4 (Copa América, Finalissima, World Cup) | 2 (UEFA Euro, UEFA Nations League) |
| Ballon d’Or Wins | 8 | 5 |
Messi’s 2022 World Cup is the trump card in the trophy debate, the ultimate achievement in the sport. Ronaldo’s European Championship with Portugal in 2016 is a monumental, legacy-defining triumph for his nation. The Champions League is Ronaldo’s fortress, with five titles to Messi’s four, but Messi’s World Cup is the single most significant trophy in this rivalry.
So, what do the player vs player stats tell us? They don’t crown a winner. They reveal a philosophical clash. Ronaldo is the ultimate sporting machine, a testament to willpower and a physical peak extended into a player’s late 30s. Messi is the maestro, a force of nature whose influence is measured in both goals and the goals he creates for others. The numbers don’t give an answer; they just make the argument infinitely more interesting.
Modern analytics tools
The debate over “player vs player stats” has moved from the pub to the server room. Now, it’s about more than just goals and assists. It’s a complex mix of data points.
From Spreadsheets to Supercomputers
Today’s scouts don’t use notebooks and stopwatches anymore. They have xG, pass maps, and radar charts. These tools show a player’s impact in ways beyond the scoresheet.
Models like VAEP and RAPM measure a player’s influence. VAEP looks at every touch, while RAPM isolates a player’s effect from his teammates. This isn’t just counting; it’s complex analysis. The use of big data and biometrics tracks everything from workload to injury risk. It gives a full view of performance.
The MBAPPE Metric and the Future of Comparison
The future of comparing players isn’t about finding a single GOAT. It’s about finding the right fit for a team. Advanced models help figure out which player fits a team’s style.
This shift, as seen in the greatest football legends, moves us from subjective debates to data-driven insights. It’s a game where the final score is written in code.