
Ever watched a match and thought you could manage better than the pros? Welcome to the world where your couch-based insights meet actual data. This isn’t just yelling at the screen anymore.
We’re exploring the tools that turn hunches into evidence. From Hudl Sportscode’s video breakdowns to Second Spectrum’s AI-enhanced footage, these platforms are changing how we understand the game.
Think of it as Moneyball for the rest of us. Instead of Brad Pitt making tough calls, it’s you with a tablet proving that 63rd-minute shot really should’ve been taken. For those looking deeper, check out our guide to advanced football data platforms used by professionals.
These systems don’t just count goals. They track movements, analyze decisions, and even measure biometrics through smart wearables. Suddenly, Monday morning quarterbacking gets a whole lot more sophisticated.
Live Stat Apps for Fans
Remember when stats were only in the morning paper or from that guy in the pub? Those days are gone. Now, live stat apps give you real-time data like xG and possession percentages.
Today’s football apps turn every game into an interactive stats playground. You’re not just watching; you’re analyzing and predicting. It’s like directing your own sports broadcast, tracking your team’s every move.

Zone14 REPLAY leads this change with its advanced features. It offers real-time analysis with tools and playlists during games. It’s available only for iOS, turning your phone into a tactical center.
The data is impressive, even for football stat experts. You get:
- Goals and assists in real-time
- Shots on target and possession percentages
- Passing accuracy metrics
- Contextual data like venues and weather
For deeper dives into interactive stats, these apps offer unmatched access. The beautiful game is now beautifully analytical, making us all better fans.
| Feature | Traditional Stats | Modern Interactive Stats |
|---|---|---|
| Update Speed | Next-day reporting | Real-time tracking |
| Data Depth | Basic metrics only | Advanced analytics |
| User Interaction | Passive consumption | Active analysis tools |
| Accessibility | Limited sources | Mobile apps available |
The shift from static numbers to interactive stats is more than tech progress. It’s a change in how we engage with sports. We’ve become active participants in every match’s data story.
Visualization Examples
Ever wonder what your team’s formation looks like after the third pint? Modern fan analysis apps turn chaotic gameplay into clear visual stories. Even your most skeptical friends can’t argue with them.
Zone14 STATS turns raw video into detailed performance metrics without expensive equipment. It measures everything from total running distance to sprint counts. It creates heat maps that reveal patterns invisible to the naked eye.
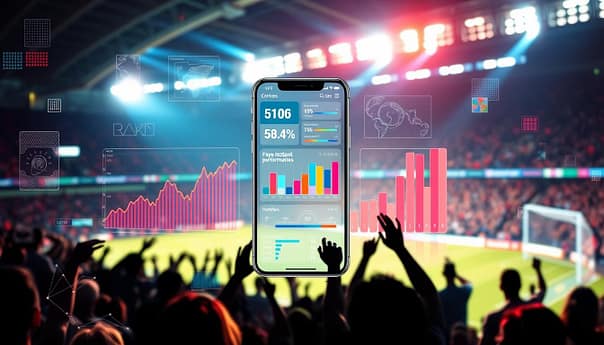
These visualizations aren’t just pretty colors – they’re tactical revelations. That heat map showing your striker’s second-half disappearance? It’s like catching someone red-handed. The right winger who treats the touchline like lava? Now everyone can see it.
The real magic happens when you combine these insights with presentation tools. Create custom playlists that highlight key moments. Then share them with coaches, players, or fellow fans. Build match highlights that make your Sunday league look like prime Barcelona (selective editing is analytics’ best-kept secret).
Best of all? These professional-grade visualizations can land on YouTube via ClubTV – completely free. It’s data storytelling so clear even your uncle who complains about the offside rule can understand it.
| Visualization Type | What It Reveals | Practical Application |
|---|---|---|
| Heat Maps | Player movement patterns | Identify positioning issues |
| Running Distance | Work rate metrics | Fitness level assessment |
| Sprint Analysis | Explosive moments | Counter-attack preparation |
| Custom Playlists | Key match moments | Coaching presentations |
These tools democratize analysis that was once reserved for pros with big budgets. Now anyone can visualize Premier League football data or their local team’s performance with equal sophistication.
The beauty of modern fan analysis apps lies in their ability to turn complex data into understandable insights. They don’t just show you what happened – they show you why it mattered, and what you can do about it next weekend.
Community Analytics Projects
Remember when football analytics felt like an exclusive club? Those days are over. Now, data analysis is a fun group project.
Community projects have changed how we see football. Amateur coaches share tactics with their teams. Fantasy football fans do deep dives that impress NASA. Even broadcasters use fan insights to improve their commentary.
When these groups meet, magic happens. Coaches explain why parking the bus fails. Players use data to get better. Fans get match highlights with smart commentary.
Here’s how different groups use community analytics:
| User Group | Primary Use | Community Benefit |
|---|---|---|
| Coaches & Trainers | Tactical development | Shared playbooks and session plans |
| Players | Performance tracking | Peer comparison and growth metrics |
| Broadcasters | Enhanced commentary | Real-time statistical insights |
| Fans | Match analysis | Free tactical breakdowns |
| Fantasy Players | Player selection | Crowd-sourced performance data |
This isn’t just dry analysis. It’s alive, changing with every game. People debate tactics like politicians, but with better results. They celebrate stats wins like scientists.
These tools have made football a collaborative sport. It’s like a Wikipedia for tactics, where everyone can contribute. The game is more than just a game; it’s a team effort.
How to Get Started
Ready to trade armchair analysis for real insights? The analytics world welcomes you with open arms. It has surprisingly reasonable entry requirements. Think of it like learning chess – the rules are simple, but mastering it takes a lifetime.
Most platforms let you test-drive before committing. Zone14 offers full-featured demo accounts for exploring interactive stats without financial pressure. Their club accounts support unlimited users, great for coaching staff collaborations.
The pricing structure is more flexible than a veteran midfielder’s hips. Here are some entry points:
- Hudl Sportscode: $400/year for youth teams
- Rev transcription: $1.99 per audio minute
- Custom enterprise solutions for larger organizations
Storage has fair-use policies within each pricing tier. You’ll never face surprise overage charges – something even your mobile carrier can’t promise.
The beauty of modern analytics platforms? They’ve removed the technical barrier that once kept fans in the dark. You don’t need a data science degree to understand why your team’s buildup play resembles a stalled elevator.
For those seeking structured learning, our guide on becoming a football data analyst provides excellent next steps. The journey from casual observer to informed analyst begins with simple exploration – and these demo accounts offer the perfect playground.
Your analytics journey starts where curiosity meets accessibility. The tools await, the data beckons, and the insights? They’re more rewarding than understanding your team’s tactical breakdown.
Tips for Deeper Analysis
So, you’ve learned to count passes and shots. Now, it’s time to dive deep into football analysis. AI apps can turn numbers into strategic insights.
Apps like zone14 STATS analyze running distance and heat maps without GPS. They support languages like German, English, and Spanish. These tools predict injury risks and second yellow cards.
The best apps don’t just collect data; they tell stories. Your heat maps should have a story. Your expected goals should be as exciting as a penalty shootout.
Great analysis shows why some passes are more important. It connects xG with tactical decisions, not coffee. This separates casual fans from true analysts who see the game’s hidden patterns.