
Goals and assists are like the Kardashians of football stats. They’re flashy and grab attention but don’t really show what’s happening.
I’ve watched many games where the score doesn’t tell the whole story. A 1-0 game might look the same as a 4-3 game in the score. But their goal differences tell different stories about how well a team plays.
Let’s get into the details. Metrics like Goal Difference and Points Per Game are key. They help smooth out the ups and downs of each game. They’re like the voice of reason at a party, reminding us that one lucky play doesn’t make a season.
Ignoring these metrics is like trying to get War and Peace from just the cliff notes. You’ll miss the whole story. Our look into football’s evolving stats shows how the game is being seen in a new light.
Building a Passing Network Map
Ever tried to understand football tactics without visual aids? It’s like watching a silent movie without subtitles. You see the action but miss the story. That’s where passing network analysis comes in, acting as your tactical translator.
Imagine a social network map, but for footballers. Instead of seeing who likes who, we track who passes to whom. The thicker the lines, the stronger the partnership. This shows a team’s tactical DNA.

Take F.C. Barcelona’s golden era. Their passing networks showed more than just ball movement. They revealed artistic patterns. Messi wasn’t just passing; he was conducting symphonies.
The pass maps showed his unique risk-taking. He preferred risky passes over safe ones.
To build these maps, we track two key metrics:
- rDP (Risk Decision Parameter): Shows how often players take high-risk passes
- gDP (Gain Decision Parameter): Evaluates the payoff of those risky passes
These decision-making parameters highlight the tactical mavericks from the safe players. Defenders stick to low-risk areas. Forwards like Messi? They play high-stakes poker with every touch.
The beauty of passing network analysis is its simplicity. Thick, glowing lines show who’s leading the team. You see the difference between teams passing for possession and those dissecting defenses.
This visual analysis turns abstract statistics into clear insights. It’s like getting HD vision after years of squinting. Suddenly, patterns and strategies become clear. Football transforms from chaos to calculated poetry.
Top Metrics to Watch
Goals are like fireworks, but advanced metrics are the magic behind them. Welcome to modern football analytics, where we look at what should have happened, not just what did.
Expected Goals (xG) is your go-to for pub debates. It’s the truth-teller that says some goals are luck, not skill. xG shows how likely a shot is to be a goal, based on past data.
Expected Assists (xA) gives credit to midfielders for their smart passes. Even if the forward misses, xA sees the midfielder’s genius.
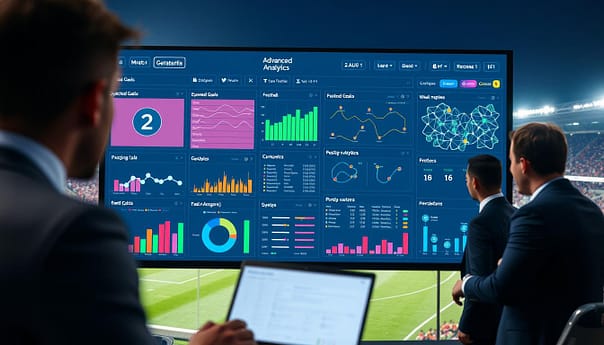
Efficiency ratios show who’s truly valuable. Goals per 90 minutes makes it fair to compare everyone. Thierry Henry’s 0.68 goals per match was a work of art.
Progressive passes show how well players move the ball. It’s not just about completing passes, but about moving the ball forward effectively.
Position-specific metrics highlight special talents:
- Goalkeepers: Post-shot expected goals (PSxG) shows their shot-stopping skill
- Defenders: Aerial duel success rates show who’s the aerial king
- Midfielders: Progressive carries show how far they push the ball forward
- Forwards: Shot-creating actions count all efforts leading to shots, not just the final touch
These modern football analytics tools change how we see the game. They help us understand football better. For more on these metrics, check out our guide to the top advanced football metrics unveiling Europe’s best.
The beautiful game is more than just goals. Now, we have numbers to back it up.
Applying Metrics for Analysis & Predictions
So you’ve collected all this data—now what? Using advanced metrics in football without context is like using a Ferrari for grocery shopping. We need models that turn numbers into wisdom.
Pythagorean expectation shows which teams are lucky versus actually good. Expected points (xPts) tells us what teams should have scored based on chance quality. Clubs like Liverpool and Brentford use these tools to gain real edges.
Machine learning takes this further, adjusting predictions mid-game when red cards change everything. This approach transforms how we scout talent and plan tactics. The right advanced metrics football framework makes sense of chaos.
This isn’t just number-crunching—it’s understanding the story behind the stats. The future of football analysis blends data with human insight, creating smarter decisions on and off the pitch.